

Trip profitability is the most critical metric that reveals the true success of a haulage operation — yet in most companies it remains invisible. A trip that looks profitable on paper can turn out to be a loss at the end of the month. Because profit is lost not in the visible freight rate, but in the invisible costs scattered across different files. In this article, we examine the 6 hidden costs that silently eat away at trip profitability in logistics, and how to make them visible on a single screen.
📊 Industry data: Per the IRU, fuel is about one-third (~30%) of total operating cost in European road transport, while most firms run on only ~2% profit margin. IRU (Uluslararası Karayolu Taşımacılığı Birliği)
What is trip profitability, and why isn’t it visible in the freight rate?
Trip profitability is the difference between the revenue a trip brings in and all the direct and indirect expenses belonging to that trip. The definition looks simple; the difficulty is that the expenses are not gathered in one place. Fuel is in one file, the driver advance in another ledger, the exchange rate difference in accounting, and the toll and storage receipts in the driver’s pocket. Because of this fragmentation, the question “which of my trips is making money?” often goes unanswered, and trip profitability is managed by guesswork.
The 6 hidden costs that eat into trip profitability
The margin of a haulage operation is thin; that is why even small leaks can turn trip profitability negative. Here are the six items most often overlooked:
- Fuel and the fuel surcharge: The single biggest determinant of cost. The fuel surcharge notices from the International Transporters’ Association (UND) show how serious increases in a short time put pressure on the freight rate.
- Empty return (empty kilometers): Every kilometer driven without a load is pure expense. According to ATRI 2025 data, the empty-mile rate in the US rose to an average of 16.7%; for the industry, that means roughly 30 billion dollars of waste per year.
- Exchange rate difference: In exports the freight rate is in one currency while expenses occur in another; the amount that melts away in between is silently deducted from trip profitability.
- Driver advance and trip expenses: When advances, per diems, tolls, visas and parking are kept on paper, the end-of-month reckoning turns into a dispute.
- Waiting, storage and demurrage: The hours spent in the loading/unloading queue create both fuel and opportunity costs.
- Maintenance, tires and depreciation: Items that do not fall on a single trip but are spread across every trip; when neglected, the real cost appears understated.
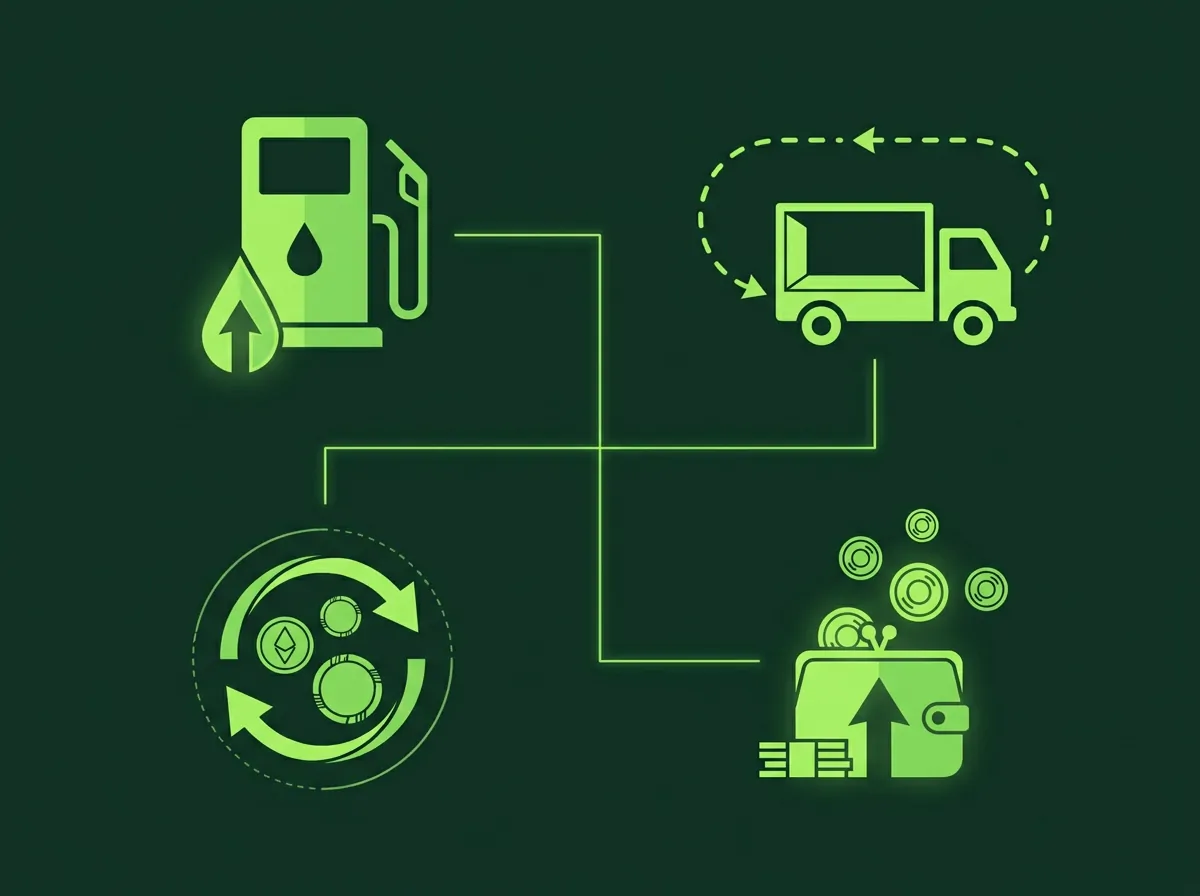
ATRI’s 2025 report reveals just how real this pressure is: truck operating margins fell below 2% in nearly every segment. In other words, a few hidden cost items can easily turn a seemingly profitable trip into a loss.
How do you make trip profitability visible?
The solution can be summed up in one sentence: combine revenue and all expenses in the same record. A logistics ERP breaks down trip profitability separately by trip, lane, customer, driver and vehicle. This way you build the statement “the Berlin lane is making money, Madrid is losing money” with data rather than guesswork.

In practice this means: on the trip management side, revenue and expenses are gathered in a single flow; driver reconciliation processes advances and expenses automatically; and finance management shows the exchange rate difference accurately with a multi-currency account statement. When the three come together, trip profitability stops being a guess and becomes a measured number.
Who does this problem hit the hardest?
Growing fleets are the most affected. With 1-5 vehicles, Excel seems sufficient; but once a fleet exceeds 10-15 vehicles, that file stops being an asset and turns into a hidden cost. As the number of trips increases, it becomes impossible to track by eye which job is making money, and trip profitability slips out of control.
3 practical steps to increase profit
Visibility is the first step; after that, the following three moves directly improve the margin:
- Reduce empty returns: Plan the return load in advance. Lowering empty kilometers is the fastest and most certain gain available.
- Re-price the loss-making lane: On a route proven by data to be losing money, either update the freight rate or shift the vehicle and driver to profitable work.
- Record the expense instantly: Process the driver advance and trip expenses as soon as the trip departs; eliminate the surprises and the dispute in the end-of-month reconciliation.
These three steps make visible again the real profit that scattered data hides, and move your decisions from guesswork to evidence.
Frequently Asked Questions
What is the difference between trip profitability and the freight rate?
The freight rate is the revenue of the trip; trip profitability is the real result that remains after all expenses such as fuel, empty kilometers, costs and the exchange rate difference are deducted from that revenue.
Do empty kilometers really affect trip profitability this much?
Yes. Every kilometer driven without a load burns fuel, maintenance and depreciation but brings in no revenue; industry data shows that empty kilometers are one of the biggest hidden losses.
Can’t trip profitability be tracked with Excel?
It is possible with few vehicles; but as multiple currencies, scattered expenses and the number of trips increase, Excel loses currency and accuracy. A system that combines everything in a single record solves this problem.
See your real trip profitability today
Manage with data, not guesswork: gather revenue and all expenses on a single screen, and see clearly which of your trips is truly making money. Explore Loggerise ERP 👉 loggerise.com. If you are looking for a lightweight solution for small fleets, you can also check out our sister platform LoggyGo.